
LUFS vs dB Explained: Audio Loudness Guide for Creators — complete guide
You've just finished mixing your latest track. The meters look healthy, the sound is punchy, and everything feels right in your DAW. Then you upload it to Spotify, and suddenly your track sounds quieter than everything else in the playlist. What went wrong?
The answer lies in understanding two critical measurements that every audio creator must master: LUFS and dB. These aren't just technical jargon reserved for mastering engineers—they're the difference between your content sounding professional across every platform or falling flat against the competition.
Whether you're a music producer, podcaster, YouTuber, or voiceover artist, this guide will break down exactly what LUFS and dB mean, how they differ, and how to use both to make your audio shine everywhere it's heard.
What is dB (Decibels)? The Complete Breakdown
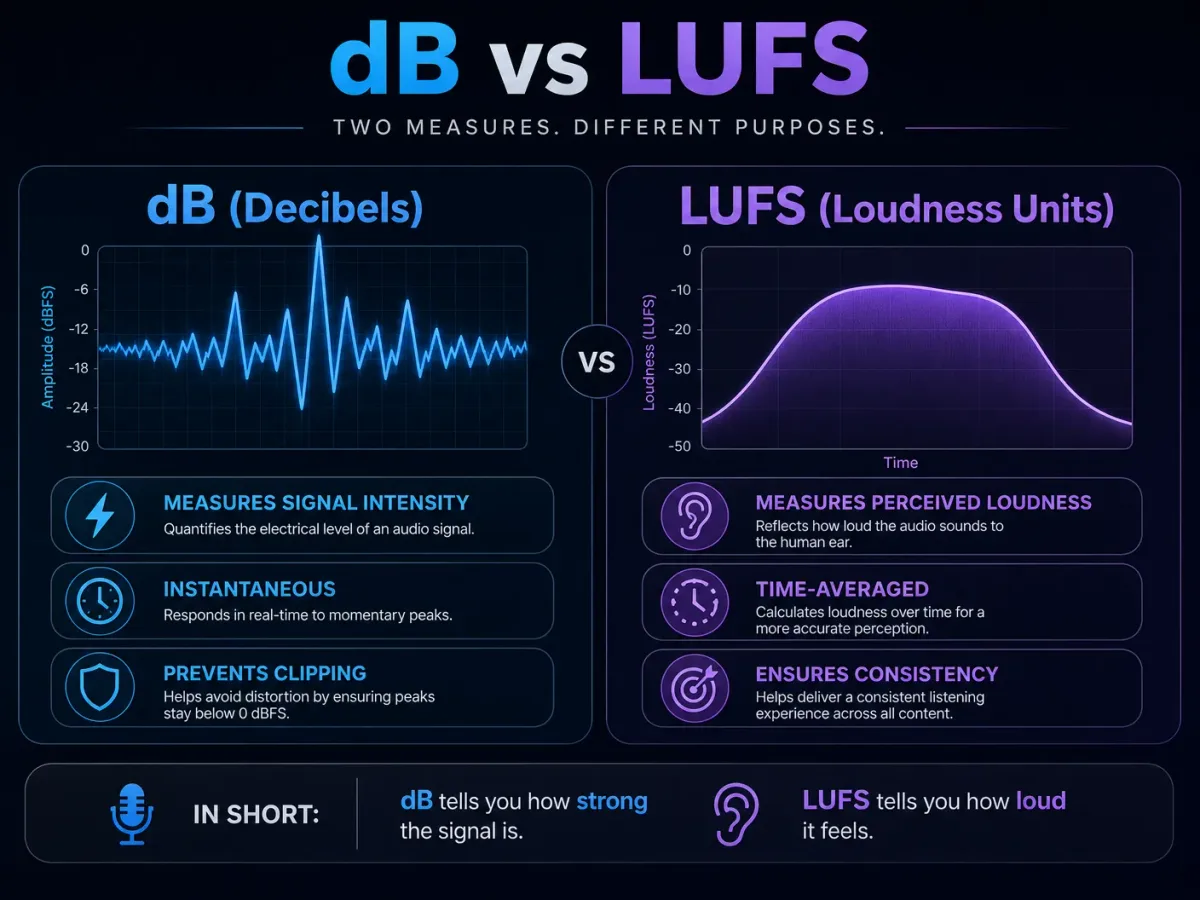
Decibels (dB) represent the most fundamental unit of audio level measurement. At its core, dB measures the intensity of an audio signal using a logarithmic scale. This means that every 6 dB increase roughly doubles the signal amplitude, while every 10 dB increase sounds approximately twice as loud to human ears.
But here's where it gets important for creators: not all dB measurements are the same. You'll encounter several types in your audio journey:
dBFS (Decibels Full Scale) is the standard in digital audio. Zero dBFS represents the absolute maximum level your digital system can handle. Everything below is measured in negative numbers. When your DAW meter hits 0 dBFS, you're clipping—and that means distortion.
dBSPL (Sound Pressure Level) measures actual physical sound in the real world—the loudness of your studio monitors, your room noise, or a concert.
dBTP (True Peak) measures inter-sample peaks that occur between digital samples. This is crucial because regular peak meters can miss these hidden spikes that cause distortion on playback systems.
What dB Tells You (and What It Doesn't)
Think of dB as a speedometer in your car. It shows you exactly how fast you're going at this precise moment. Hit the red zone? You're clipping. Stay too low? Your signal-to-noise ratio suffers.
But here's the critical limitation: dB does NOT tell you how loud your audio actually sounds to a human listener. A track can peak at -1 dBFS and still sound quieter than another track peaking at -3 dBFS. Why? Because perceived loudness depends on frequency content, duration, and density—not just peak levels.
This limitation is exactly why LUFS was created.
What is LUFS? The Complete Breakdown
LUFS stands for Loudness Units Full Scale, and it represents a revolutionary shift in how we measure audio. Unlike dB, which measures electrical signal level, LUFS measures how loud audio actually feels to human ears over time.
LUFS was born from the ITU-R BS.1770 Loudness Measurement Standard standard and the European Broadcasting Union's R128 specification. These organizations recognized that peak levels alone couldn't ensure consistent listening experiences across different content. A classical symphony and a heavy metal track might peak at the same dBFS level, but they'd sound dramatically different in terms of loudness.
How LUFS Works: K-Weighting
LUFS uses a K-weighting filter that mimics how human ears actually perceive sound. We're naturally more sensitive to frequencies between 1-5 kHz (where speech clarity lives) and less sensitive to low bass frequencies. The K-weighting curve accounts for this, giving you a measurement that correlates with actual human perception.
Three Types of LUFS Measurement
Integrated LUFS measures the average loudness of your entire track or episode from start to finish. This is the number streaming platforms use for normalization. When Spotify says they target -14 LUFS, they mean integrated LUFS.
Short-term LUFS provides a 3-second rolling measurement window. This helps you identify sections that might be significantly louder or quieter than your overall target—useful during mixing to maintain consistency.
Momentary LUFS offers a rapid 400-millisecond snapshot. Think of it as your real-time loudness indicator, showing immediate fluctuations as they happen.
LUFS vs dB: The Key Differences That Actually Matter
Now that you understand both measurements individually, let's put them head-to-head:
| Feature | dB (Decibels) | LUFS |
|---|---|---|
| Measures | Signal amplitude/peak level | Perceived loudness |
| Time Factor | Instantaneous (moment-in-time) | Time-weighted (averaged) |
| Frequency Weighting | Flat (all frequencies equal) | K-weighted (mimics human hearing) |
| Primary Purpose | Prevent clipping/distortion | Ensure consistent loudness across content |
| Used By | Recording/mixing engineers | Streaming platforms/broadcast |
| Scale | 0 dBFS = digital maximum | -14 LUFS = typical streaming target |
The Analogy That Makes It Click
Imagine you're driving from New York to Los Angeles:
- dB is your speedometer—it tells you exactly how fast you're going right now. You need it to avoid speeding (clipping), but it says nothing about your overall journey.
- LUFS is your average trip speed—it tells you how fast your journey felt overall. You might have had moments at 80 mph and moments at 30 mph, but your average captures the complete experience.
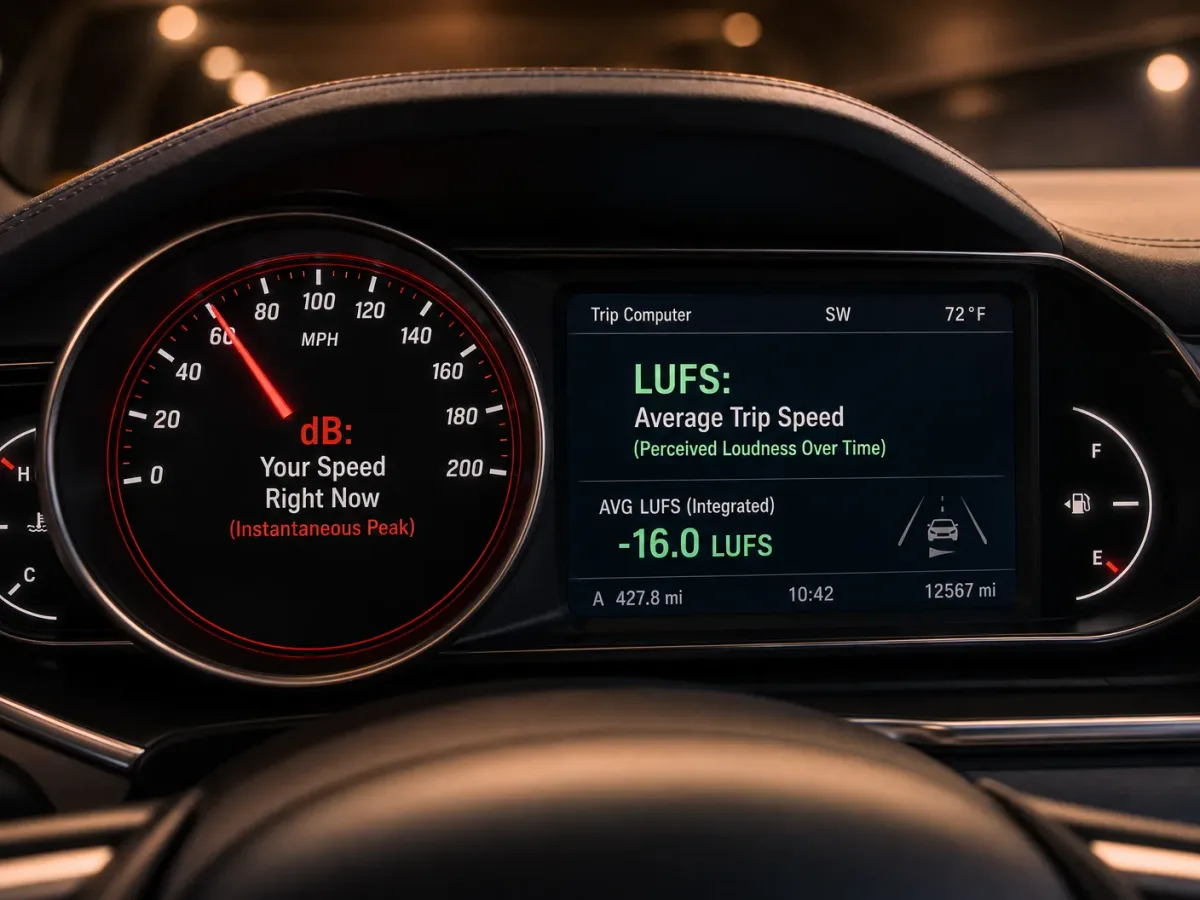
Both are essential. You need the speedometer to stay safe in the moment, and you need the average to understand and plan your overall journey.
Real-World Example
Consider two tracks, both peaking at exactly -1 dBFS:
- Track A: A heavily compressed pop song with minimal dynamic range. Integrated LUFS: -8 LUFS.
- Track B: A dynamic orchestral piece with huge crescendos and soft passages. Integrated LUFS: -18 LUFS.
Same peak level. Completely different perceived loudness. If you only watched dB meters, you'd think they were equally loud. LUFS reveals the truth.
Why This Matters for Music Producers & Mixing Engineers
The music industry fought the "Loudness War" for decades—pushing masters hotter and hotter, sacrificing dynamic range for raw volume. LUFS effectively ended that war.
Here's why: streaming platforms normalize everything. If you master your track at -8 LUFS and Spotify's target is -14 LUFS, they'll simply turn your track down by 6 dB. Your hyper-compressed, squashed master now sounds quieter AND less dynamic than a well-mastered track that was delivered at -14 LUFS with full dynamics intact.
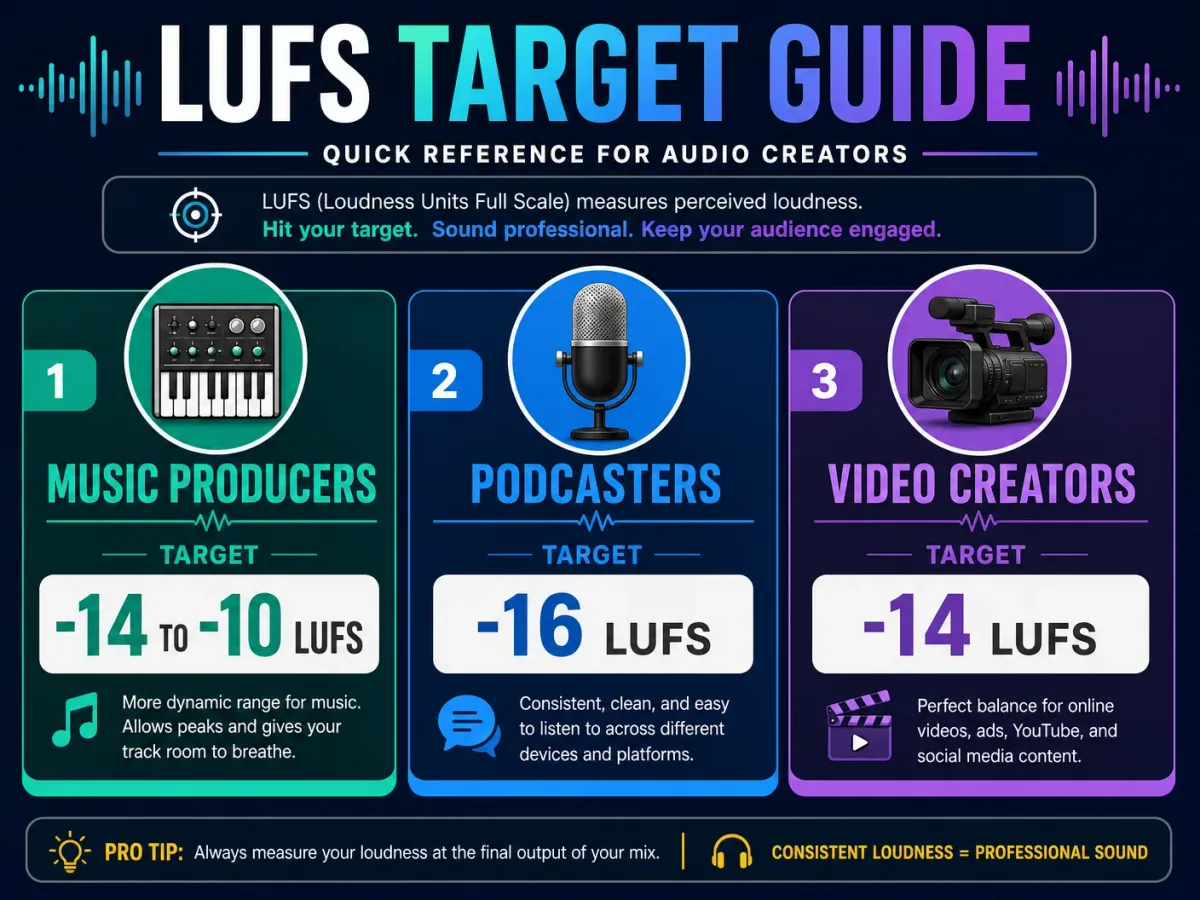
Practical Targets for Music Producers
- Spotify/Apple Music/YouTube: -14 LUFS integrated, -1 dBTP true peak
- Dynamic genres (jazz, classical, folk): -16 to -20 LUFS with wider dynamic range
- Loud genres (EDM, hip-hop, pop): -10 to -14 LUFS with controlled dynamics
- Soundcloud/Club music: -8 to -10 LUFS (louder targets still relevant here)
The Loudness-War Master That Backfires on Streaming
Here is the scenario that catches producers out, and it is worth understanding because the mistake is invisible until the track is already live. A beat is mastered extremely loud — say -6 LUFS integrated, peaking just under 0 dBFS, with almost no dynamic range left. On a platform that plays files back at whatever level you uploaded, that strategy worked, and for years it did.
Streaming broke it. Spotify normalises playback towards roughly -14 LUFS, so a -6 LUFS master gets turned down by around 8 dB before anyone hears it. What the listener gets is not a loud track; it is a squashed track played quietly. Next to a song mastered to -14 LUFS with its dynamics intact, it sounds flat and small — the exact opposite of what the loud master was for. Re-mastering nearer the target with real peak headroom, around -1 dBTP, gives the platform nothing to turn down, and the result genuinely sounds louder and more alive at the same playback level. That is the whole argument against chasing raw level in 2026, and it is mechanical rather than a matter of taste.
Why This Matters for Podcasters & Voiceover Artists
Podcast listeners are particularly sensitive to loudness inconsistency. Unlike music listeners who might accept variation between songs, podcast audiences notice immediately when Episode 12 is louder than Episode 11, or when a guest sounds quieter than the host.
Podcast Loudness Standards
- Apple Podcasts: -16 LUFS (mono), -1 dBTP
- Spotify Podcasts: -14 LUFS (their standard normalization)
- General podcast best practice: -16 LUFS integrated, -1.5 dBTP true peak
- Audiobooks (ACX/Audible): -18 to -23 LUFS, -3 dBFS peak, noise floor below -60 dBFS
The Consistency Challenge
The biggest podcasting loudness mistake isn't being too loud or too quiet—it's being inconsistent. When your solo episodes are -14 LUFS but your interview episodes are -20 LUFS because the guest's audio was quieter, listeners constantly reach for the volume knob. That's a terrible experience.
Step-by-step podcast loudness workflow:
- Record with peaks hitting between -12 dBFS and -6 dBFS (healthy recording level)
- Apply compression to even out dynamic range
- Use a loudness meter to check integrated LUFS of the full episode
- Apply makeup gain or limiting to hit your target (-16 LUFS recommended)
- Verify true peak stays below -1.5 dBTP
- Compare with your previous episodes to ensure consistency
Why This Matters for YouTubers & Video Editors
YouTube normalises loudly mastered uploads down towards roughly -14 LUFS. The important detail, and the one most guides get wrong, is that it does not work in both directions: if your video measures -8 LUFS YouTube turns it down, but if it measures -20 LUFS YouTube leaves it quiet. Nothing rescues an under-level upload, so the viewer simply reaches for their volume control — which is why aiming for the target matters more than staying safely below it.
But here's the unique challenge for video creators: you're balancing multiple audio elements simultaneously—dialogue, music, sound effects, and ambient sound.
The Common YouTube Audio Problem
My background music keeps drowning out my voice.
This happens when you set levels by watching dB peak meters alone. Your voice might peak at -6 dBFS and your music might peak at -12 dBFS, so technically the music is "quieter." But the music's integrated LUFS might actually be higher than your dialogue because music is continuous while speech has natural pauses.
Solution: Mix your dialogue to sit at -14 to -12 LUFS short-term, and set your background music at -24 to -20 LUFS short-term. This creates a 6-10 LUFS difference that keeps dialogue clear and present.
Recommended Targets for YouTube
- Overall video loudness: -14 LUFS integrated
- Dialogue: -14 to -12 LUFS short-term
- Background music: -24 to -20 LUFS short-term
- Sound effects: Brief, can peak higher momentarily
- True peak: -1 dBTP maximum
Every Major Platform's Loudness Standard (2026 Reference)
Here's your complete, bookmarkable reference chart:
| Platform | Target LUFS (Integrated) | True Peak Maximum | Notes |
|---|---|---|---|
| Spotify | -14 LUFS | -1 dBTP | Normalizes both up and down |
| Apple Music | -16 LUFS | -1 dBTP | Sound Check feature |
| YouTube | -14 LUFS | -1 dBTP | Normalizes down only |
| Tidal | -14 LUFS | -1 dBTP | Similar to Spotify |
| Amazon Music | -14 LUFS | -2 dBTP | Slightly stricter true peak |
| Deezer | -15 LUFS | -1 dBTP | Between Spotify and Apple |
| SoundCloud | -14 LUFS | -1 dBTP | Recently added normalization |
| Apple Podcasts | -16 LUFS | -1 dBTP | Mono recommended for speech |
| Spotify Podcasts | -14 LUFS | -1 dBTP | Matches music normalization |
| Broadcast TV (EU - EBU R128 Loudness Recommendation) | -23 LUFS | -1 dBTP | Strictest standard |
| Broadcast TV (US - ATSC A/85) | -24 LKFS | -2 dBTP | LKFS = LUFS (same unit) |
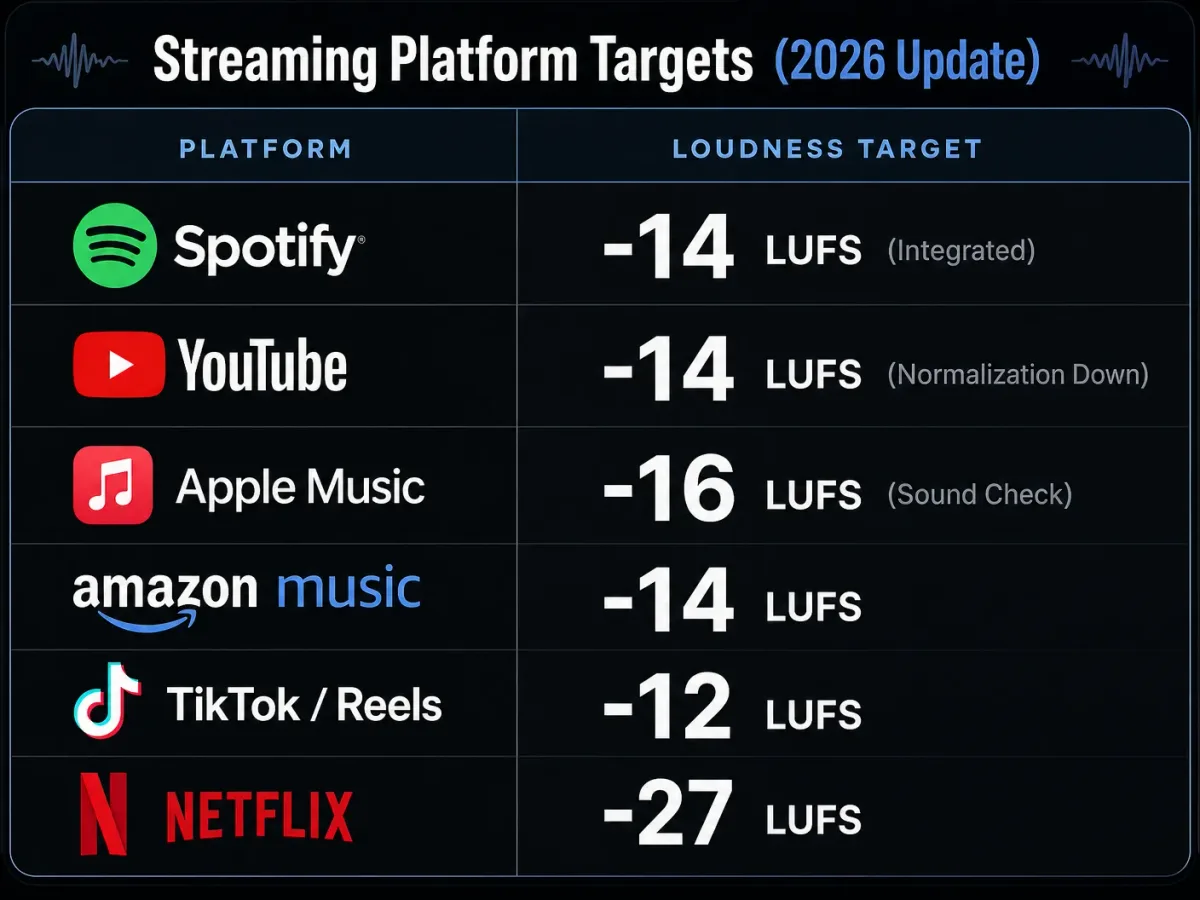
What happens if you're too loud? The platform turns your audio down, and your over-compressed master loses its punch compared to properly mastered content.
What happens if you're too quiet? Some platforms (Spotify) turn you up, potentially raising your noise floor. Others (YouTube) leave you quiet, making listeners reach for the volume.
Best Loudness Metering Tools for Creators
Free Tools
Youlean Loudness Meter 2 is the gold standard for free loudness metering. It displays integrated, short-term, and momentary LUFS along with true peak, loudness range, and dynamic range. It even shows platform-specific compliance. Available as VST/AU/AAX plugin for every major DAW.
dpMeter5 by TBProAudio offers clean, CPU-efficient LUFS metering with true peak detection. Perfect for creators running older systems.
MLoudnessAnalyzer by MeldaProduction comes with MeldaProduction's free bundle and provides comprehensive loudness analysis.
Paid Professional Tools
iZotope Insight 2 provides broadcast-grade metering with a visual spectrogram, loudness history, and intelligibility metering, which makes it the easiest of these to read while balancing dialogue against music.
NUGEN VisLM is the closest thing to a broadcast-industry default, with the most detailed compliance checking and logging if you are delivering to a spec sheet rather than to a platform.
Waves WLM Plus is the usual value pick, with loudness metering built specifically around broadcast and streaming compliance targets.
FabFilter Pro-L 2 combines a very good limiter with built-in LUFS metering, so you can master and measure in the same plugin instead of switching windows.
Plugin pricing in this category moves constantly and all four of these go on sale regularly, so check the current retailer listing rather than budgeting from any figure quoted in an article. If you only need the number and not the extra tooling, the free meters above measure integrated LUFS just as accurately.
Step-by-Step: Setting Up Loudness Metering in Your Workflow
- Insert a loudness meter on your master bus (Youlean is perfect for this)
- Reset the meter before playing your track/episode from start to finish
- Play the entire piece without stopping—integrated LUFS needs the full runtime
- Check three numbers: Integrated LUFS, True Peak (dBTP), and Loudness Range (LRA)
- Compare to your target platform using the chart above
- Adjust if needed: Use a limiter to reduce peaks, or gain to raise/lower overall level
- Re-measure after any adjustments to confirm compliance
Conclusion: Stop Guessing, Start Measuring
The difference between amateur and professional audio often isn't expensive microphones or premium plugins—it's understanding loudness management. Now you know that:
- dB prevents technical problems (clipping, distortion, noise)
- LUFS ensures perceptual consistency (how your audio actually sounds to listeners)
- You need both measurements working together in your workflow
Your Action Steps Today:
- Download Youlean Loudness Meter (free) and install it in your DAW
- Measure your last three releases/episodes—check their integrated LUFS and true peak
- Identify your primary platform and note its loudness target
- Adjust your workflow to check LUFS before every single upload
- A/B test your content against professional releases on your target platform
The creators who understand loudness measurement don't just make better-sounding content—they make content that performs better on algorithms, retains more listeners, and stands shoulder-to-shoulder with major-label productions and network podcasts.
Loudness targets differ per platform, so once the theory is clear the next step is delivery. Our YouTube LUFS guide covers the -14 LUFS workflow end to end, the Shorts export settings guide covers vertical video, and the YouTube bitrate comparison explains what survives the re-encode after you hit upload.
Your audience deserves consistent, professionally-leveled audio. Now you have the knowledge to deliver it.
Transparent Disclosure: The author is the Founder of Audio Forge Pro. Recommendations reflect genuine relevance to this topic. Core audio processing is free with no login required.
Responses
Join the community discussion. Sign in with Google to post a comment after the page finishes loading.